3.5. Spectral Signature Plot
The window Spectral Signature Plot includes several functions for displaying spectral signature values as a function of wavelength (defined in the Band set).
Signatures can be added to the Spectral Signature Plot through the SCP dock.
The window Spectral Signature Plot includes also some functions useful for the definition of value ranges used by the Land Cover Signature Classification (see LCS threshold).
Overlapping signatures (belonging to different classes or macroclasses) are highlighted in orange in the table Plot Signature list; the overlapping check is performed considering MC ID or C ID according to the setting Use  MC ID C ID in Algorithm.
Overlapping signatures sharing the same ID are not highlighted.
MC ID C ID in Algorithm.
Overlapping signatures sharing the same ID are not highlighted.
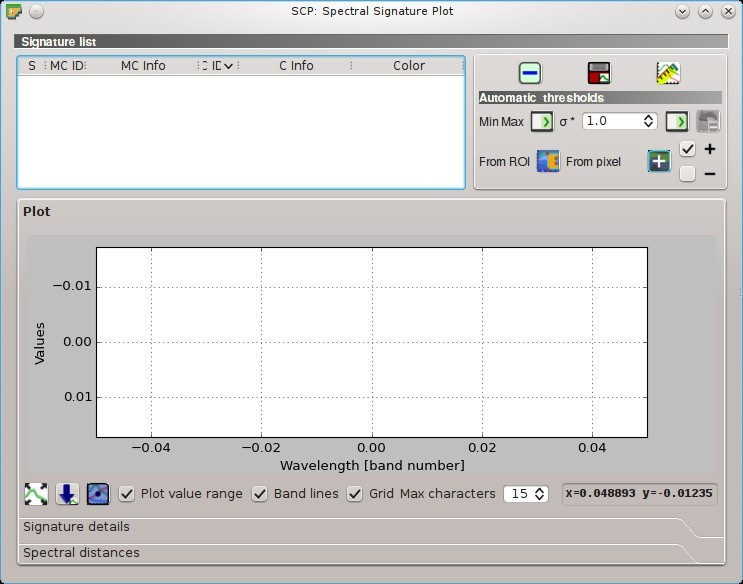
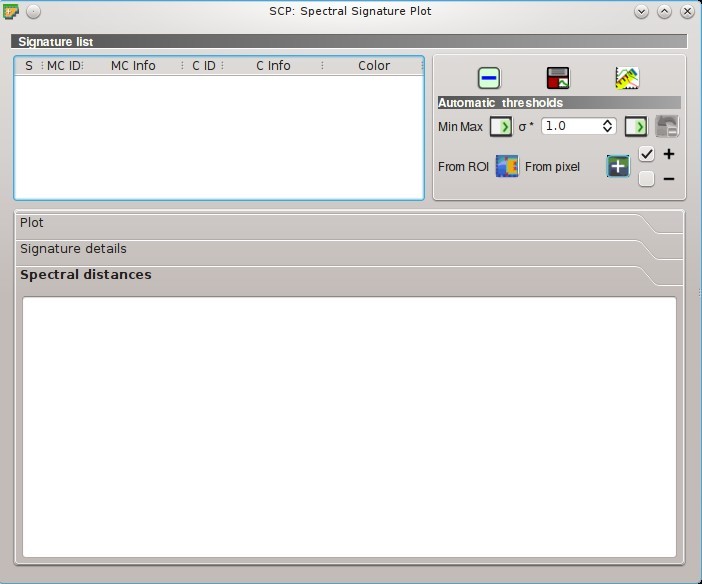
Spectral Signature Plot
3.5.1. Plot Signature list
 Signature list:
- S: checkbox field; if checked, the spectral signature is displayed in the plot;
- MC ID: signature Macroclass ID;
- MC Info: signature Macroclass Information;
- C ID: signature Class ID;
- C Info: signature Class Information;
- Color [overlap MC_ID-C_ID]: signature color; also, the combination MC ID-C ID is displayed in case of overlap with other signatures (see Land Cover Signature Classification);
- Min B
X: minimum value of bandX; this value can be edited; - Max B
X: maximum value of bandX; this value can be edited;
 : remove highlighted signatures from this list;
 : add highlighted spectral signatures to ROI Signature list;
 : calculate the spectral distances of spectral signatures displayed in the plot; distances are reported in the tab Spectral distances;
3.5.1.1. Automatic thresholds
Set thresholds automatically for highlighted signatures in the table Plot Signature list; if no signature is highlighted, then the threshold is applied to all the signatures.
- Min Max
 : set the threshold based on the minimum and maximum of each band;
 - σ *
 : set an automatic threshold calculated as (band value + (σ * v)), where σ is the standard deviation of each band and v is the defined value;
  : undo the last automatic thresholds;
- From ROI
 : set the threshold using the temporary ROI pixel values, according to the following checkboxes:
 - +: if checked, signature threshold is extended to include pixel signature;
- –: if checked, signature threshold is reduced to exclude pixel signature;
- From ROI
- From pixel
 : set the threshold by clicking on a pixel, according to the following checkboxes:
 - +: if checked, signature threshold is extended to include pixel signature;
- –: if checked, signature threshold is reduced to exclude pixel signature;
- From pixel
3.5.1.2. Plot
Left click and hold inside the plot to move the view of the plot. Use the mouse wheel to zoom in and out the view of the plot. Right click and hold inside the plot to zoom in a specific area of the plot. Legend inside the plot can be moved using the mouse.
Plot commands:
 : automatically fit the plot to data;
 : save the plot image to file (available formats are
 .jpg,.png, and.pdf); : activate the cursor for interactively changing the value range of highlighted signatures in the plot; click the plot to set the minimum or maximum value of a band (also for several signatures simultaneously); cursor is deactivated when moving outside the plot area;
- Plot value range: if checked, plot the value range for each signature (semi-transparent area);
- Band lines: if checked, display a vertical line for each band (center wavelength);
- Grid: if checked, display a grid;
- Max characters : set the maximum length of text in the legend;
- x y: display x y coordinates of mouse cursor inside the plot;
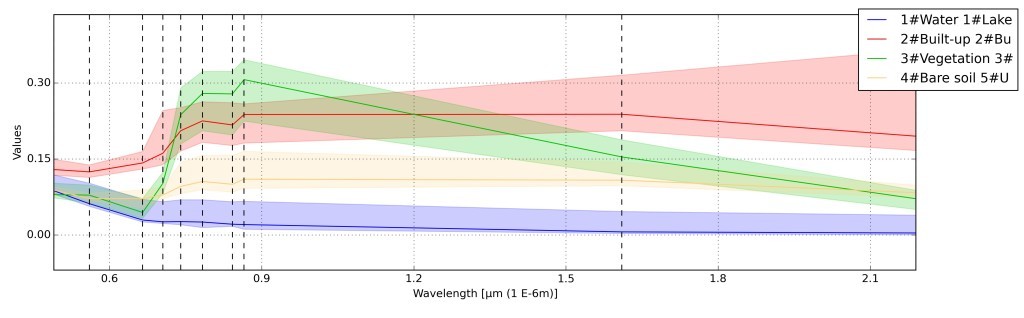
Spectral Signature: Example of spectral signature plot
3.5.1.3. Signature details
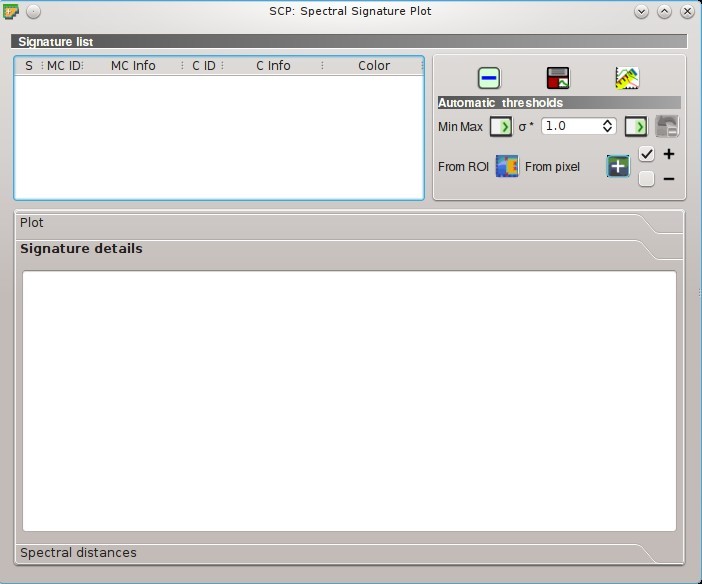
Spectral Signature: Signature details
Display the details about spectral signatures (i.e. Wavelength, Values, and Standard deviation). In case of signatures calculated from ROIs, the ROI size (number of pixels) is also displayed.
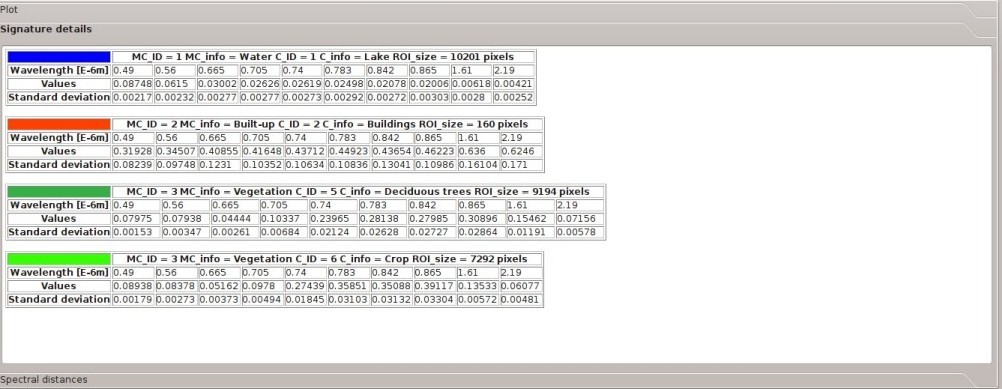
Spectral Signature: Example of signature details
3.5.1.4. Spectral distances
Spectral Signature: Spectral distances
Display spectral distances of signatures (see Plot Signature list), which are useful for assessing ROI separability (see Spectral Distance).
- The following spectral distances are calculated :
- Jeffries-Matusita Distance: range [0 = identical, 2 = different]; useful in particular for Maximum Likelihood classifications;
- Spectral Angle: range [0 = identical, 90 = different]; useful in particular for Spectral Angle Mapping classifications;
- Euclidean Distance: useful in particular for Minimum Distance classifications;
- Bray-Curtis Similarity: range [0 = different, 100 = identical]; useful in general;
Values are displayed in red if signatures are particularly similar.
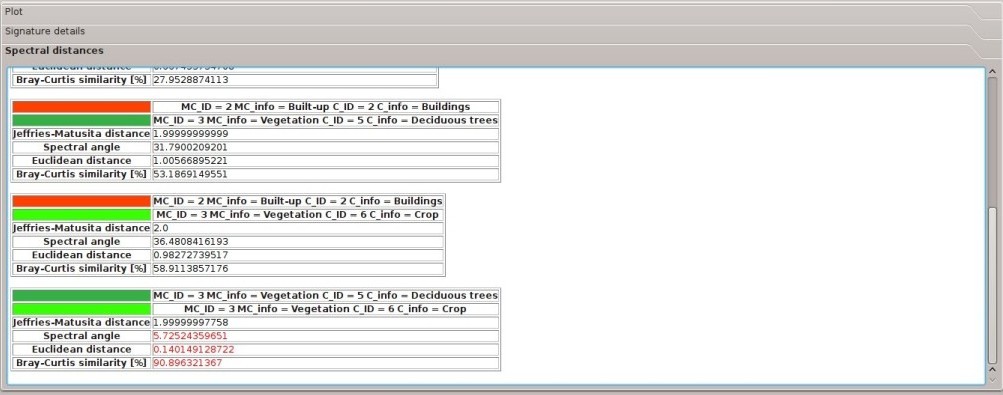
Spectral Signature: Example of spectral distances